Welcome to the pfhrp2/3 Planner
How to use this tool
This tool is designed to help researchers conducting Plasmodium falciparum hrp2/3 gene deletion studies. It can be used in two ways:
1. In the design phase (before data have been collected) to help guide the appropriate number of health facilities and a sample size per health facility.2. In the analysis phase (once data are available) to estimate prevalence of deletions and determine if they are above a set threshold.
The ideal plan would be to perform both steps, i.e., using this app before a study has started to choose target sample sizes and then returning to the app once data are available. However, it is valid to analyse data even if sample sizes were chosen using a different method (see FAQs ).
For those wanting more background information on the method, or who want to perform more advanced analyses, please take a look at the DRpower R package that underpins this app.
Our framework
Now go ahead and start exploring!
Acknowledgments
This tool was developed by Shazia Ruybal-Pesántez and Bob Verity, Malaria Modelling Group, Imperial College London, in collaboration with the Global Malaria Programme, World Health Organisation (WHO).
How to reference
Ruybal-Pesántez S and Verity R (2023). DRpower and pfhrp2/3 planner app: Study design and analysis for pfhrp2/3 deletion prevalence studies. R package version 1.0.3 and R Shiny app version 1.0.2. https://shiny.dide.ic.ac.uk/DRpower-app
Data privacy disclaimer
This web application does not store any data within the application itself. Data is temporarily stored on our the Shiny server during your active session and/or when you save your results for export into the downloadable report. Please note that any refresh or reload of the page will result in the loss of data, as it is not stored beyond the duration of your session.
Most recent update 9 December 2024.
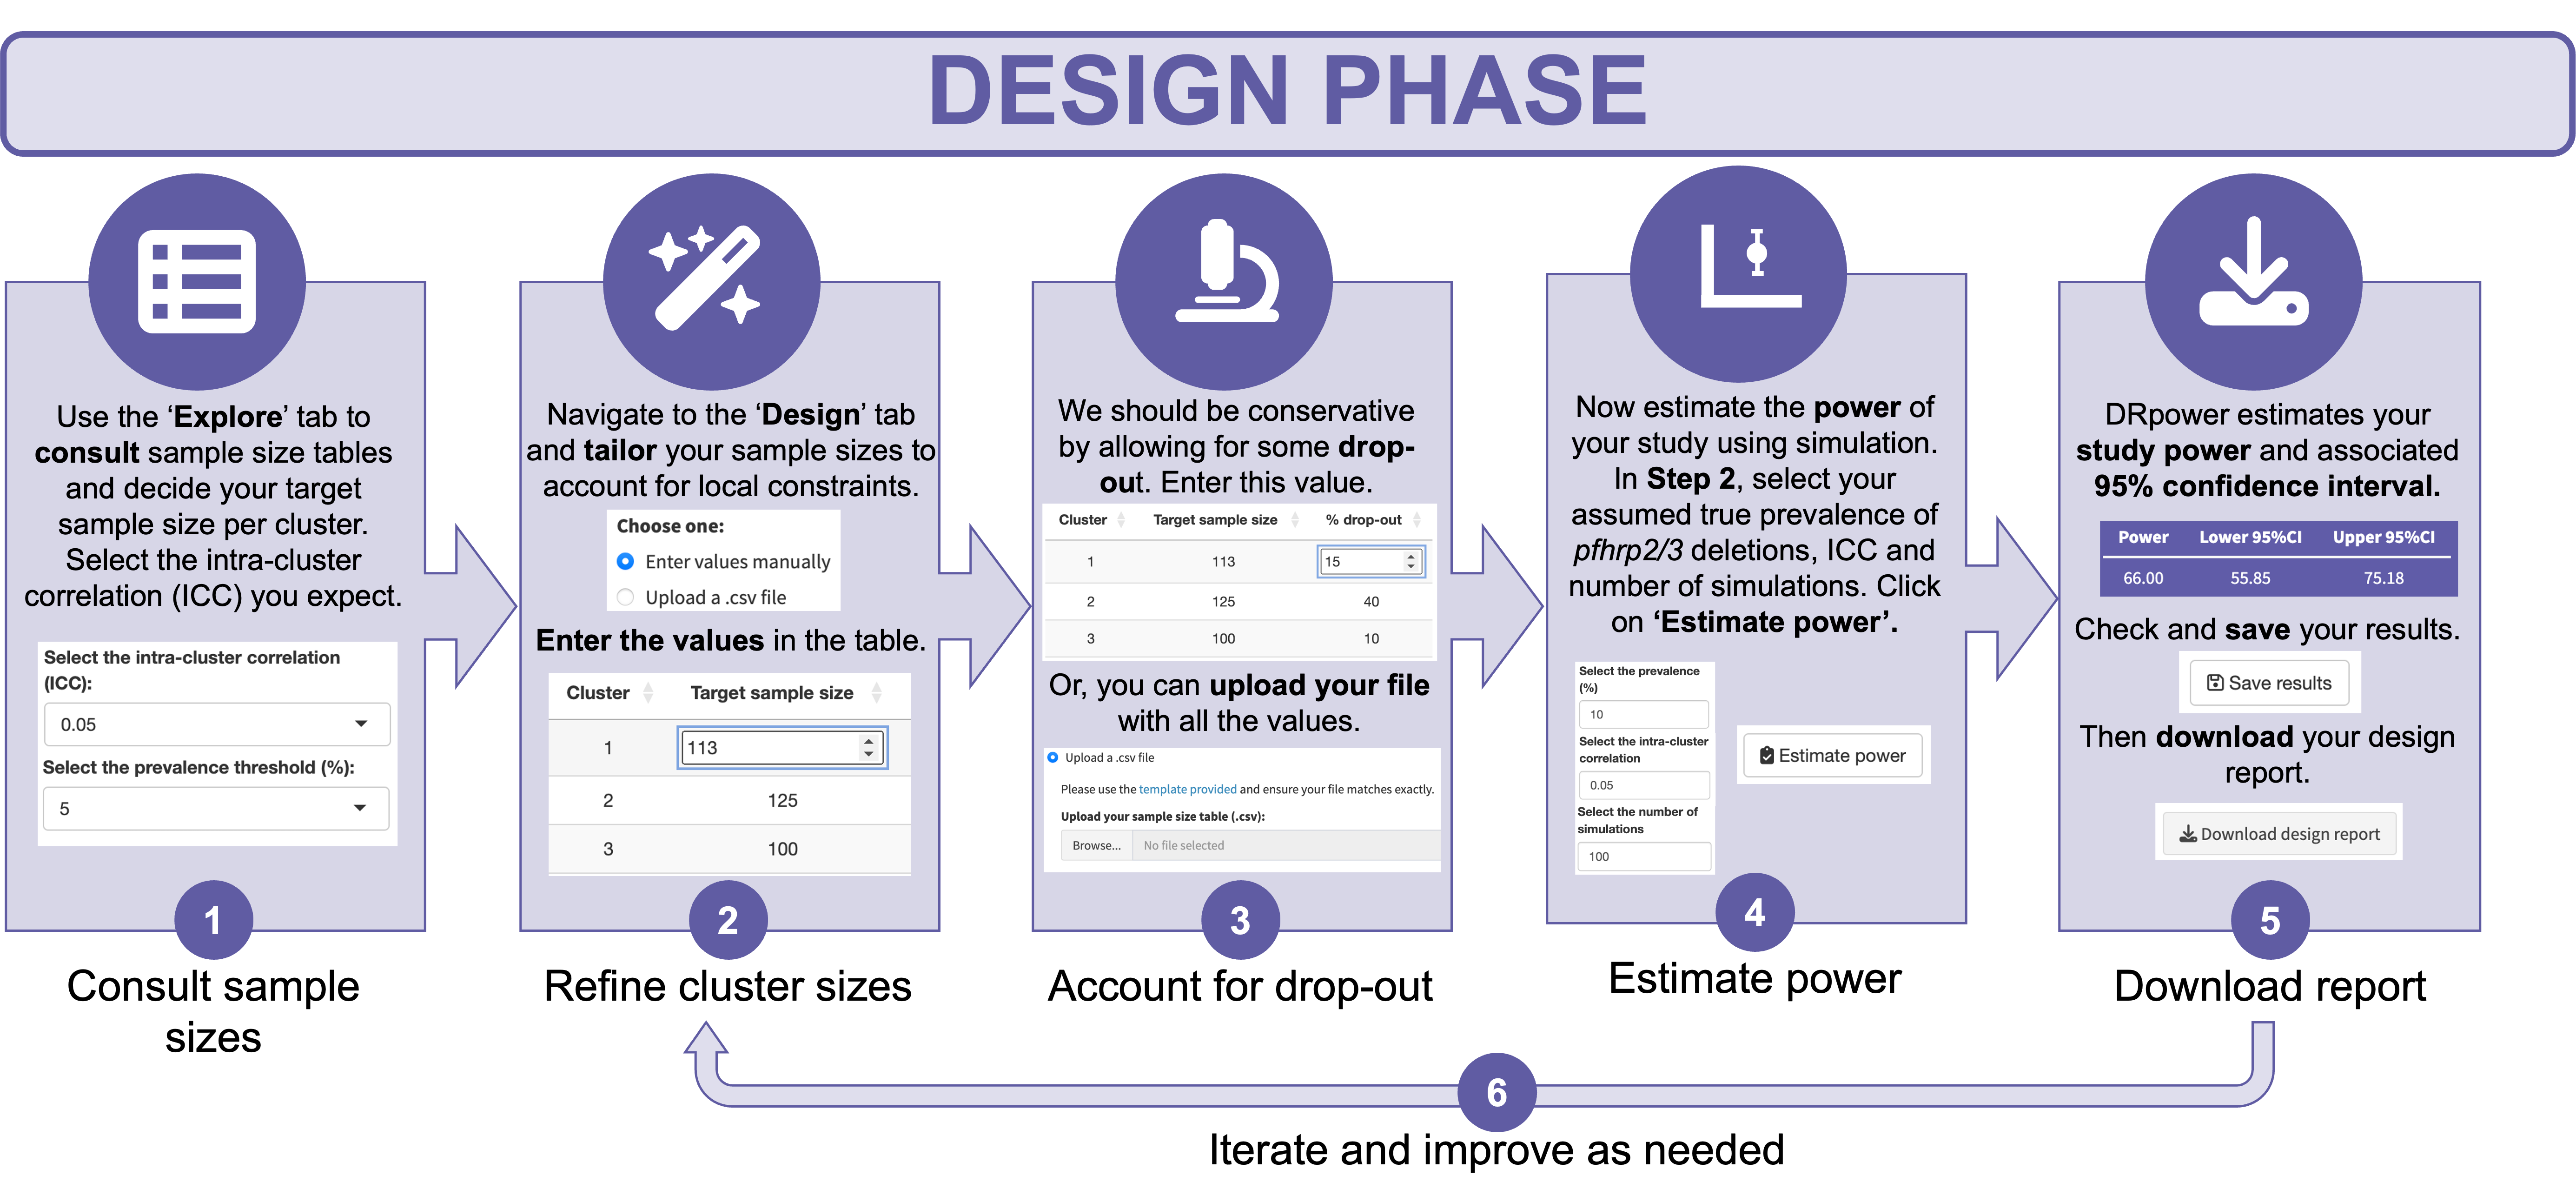
How many samples per health facility? How many health facilities?
The table below gives the number of confirmed malaria positive samples required per health facility in order for study power to be 80% or higher. You can use these numbers as a general guide when scoping out a study plan, before moving to more tailored sample sizes in the Design step.Sample sizes per health facility required to achieve a target power of 80%
Refine your health facility sizes
Sample size tables assume you will collect the same number of samples in every health facility, but this may not be possible in practice. Here, you can enter your final target sample size in each health facility and then estimate power directly. Generally, surveys will focus on health facilities but the 'cluster' could be different in specific situations.When choosing sample sizes, remember this is the number of confirmed malaria positive individuals. Check with local teams to see how many cases can realistically be recruited within the study period based on local incidence trends. You can also use this table to account for drop-out, which can occur for many reasons from participants withdrawing consent to failure of lab samples. Local staff and technicians may be able to advise on sensible values for assumed drop-out.
1. Enter sample sizes specific to your study
2. Estimate power
Check and save your parameters and results
Click the button below to display a summary of the information you entered in the previous tab. If everything looks as expected, click on the download button to download your report PDF.
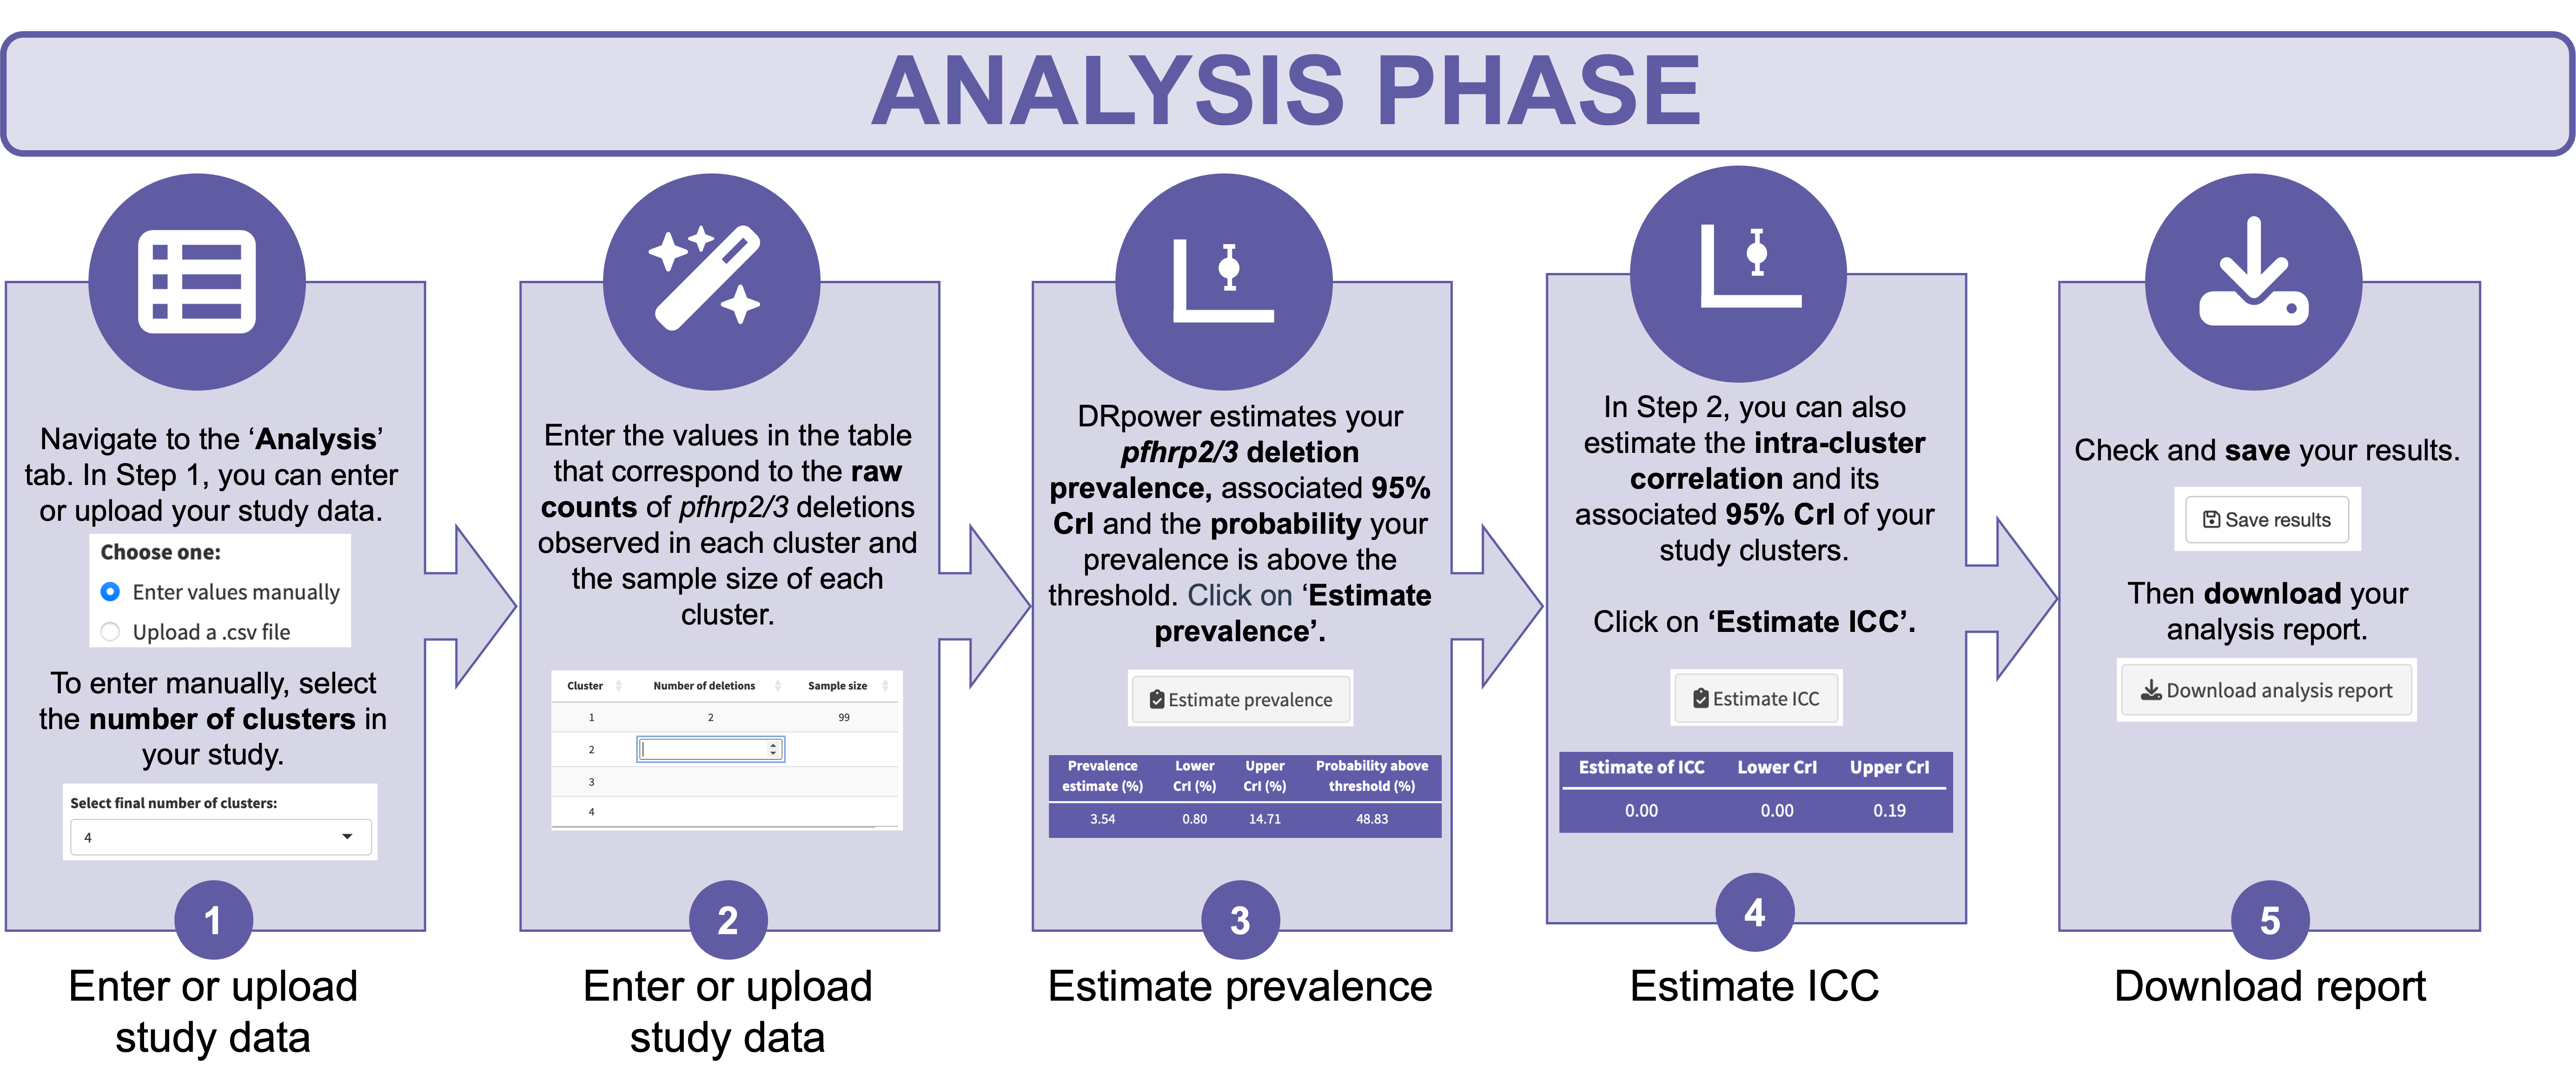
Estimate prevalence and compare against the 5% threshold
Here, you can enter your observed counts of pfhrp2/3 deletions in each health facility and use the DRpower model to estimate the prevalence of deletions along with a 95% credible interval (CrI). You can also compare prevalence against the WHO recommended 5% threshold to work out the probability of being above this threshold. Generally, surveys will focus on health facilities but the 'cluster' could be different in specific situations.If your intention is to make a binary decision as to whether prevalence is above or below the threshold (i.e., a hypothesis test) then it is worth being clear about your analysis plan before you see the result. For example, we recommend accepting that prevalence is above the 5% threshold if the probability of this outcome is 0.95 or higher (the power calculations in the Design tab assume this value). You should not change your criteria for accepting/rejecting a hypothesis once you have seen the result.
Step 1. Analyse prevalence of deletions compared with the 5% threshold
Select the final number of health facilities in your study and enter the raw number of observed pfhrp2/3 deletion counts, and the number of confirmed malaria cases per cluster.
Step 2. Analyse intra-cluster correlation (ICC)
The raw data for this analysis are taken from Step 1, and there are no additional parameters needed.
If you update any of the values in Step 1, make sure you remember to recalculate ICC
Check and save your parameters and results
Click the button below to display a summary of the information you entered in the previous tab. If everything looks as expected, click on the download button to download your report PDF.
Frequently Asked Questions (FAQs)
1. What is statistical power?
Statistical power is defined as the probability of correctly rejecting the null hypothesis. In simple terms, it is the probability of finding something interesting if it is really there.
For example, imagine that the true prevalence of pfhrp2/3 deletions in your province is 10%, and that you design a study that has 50% power to detect a prevalence over 5%. This means you are just as likely to (correctly) conclude that prevalence is above 5% as you are to reach the opposite conclusion.
Studies should generally aim for high power because conducting studies that have a low chance of success can be a waste of resources and also raises ethical issues. That being said, we cannot aim for 100% power because this would involve sampling the entire population. As a general rule of thumb, we tend to aim for power of around 80%, which is what is assumed in this app.
2. Why do I have to choose a prevalence value? Isn’t this the thing I’m trying to estimate?
This can be one of the most confusing things about power analysis! The best way to think about this is to make a distinction between the true prevalence in the domain (e.g., province, district, etc), i.e., the prevalence of pfhrp2/3 deletions if we were able to survey every single individual, and the prevalence in the sample. The prevalence in the sample is only an estimate of the true prevalence and will tend to vary around the true value by random chance. For example, we might get “lucky” and find a lot of people with the deletion, in which case our sample prevalence will be higher than the true prevalence, or we might get “unlucky” and see the opposite effect.
Imagine that the true prevalence in our province is 6%. It would only take a small amount of bad luck for the sample prevalence to be less than 5%, meaning we would come to the wrong conclusion that prevalence was below the 5% threshold. On the other hand, if the prevalence in our province is 20%, then we would have to be extremely unlucky for the sample prevalence to dip this low. This means that our chance of coming to the correct conclusion is highest when the true prevalence is a long way from the threshold. For this reason, we cannot perform power analysis without first fixing how strong our effect size is.
3. How should I decide what “true prevalence” value to assume?
This is a tricky question to answer, as it depends on the details of your study area and your specific objectives. We can ask instead: what prevalence level do you really care about detecting, i.e., what is relevant for control purposes? If the prevalence of pfhrp2/3 deletions was 5.1%, then would you want to know so that you can immediately switch RDTs? What if the prevalence was 5.001%?
In reality, we should remember that the 5% level was chosen based on an argument that this is roughly the level at which missed cases due to deletions match missed cases due to loss of sensitivity in alternative RDTs. We should treat this number as a useful guide, not a value to slavishly follow. We should also keep in mind that the closer our assumed prevalence is to the 5% threshold, the larger our sample size will need to be, up to values that are completely unrealistic for any control programme. There is a balance to be struck between sensitivity to detect a given effect size and pragmatic arguments based on logistics, budget, and ethical considerations. Here, we opt for an assumed 10% prevalence as the default, as this gives a reasonable level of sensitivity while also leading to realistic sample sizes.
4. What is intra-cluster correlation (ICC)?
Intra-cluster correlation refers to the variation between health facilities or clusters, i.e., how overdispersed they are.
Imagine we are undertaking a survey to estimate whether the pfhrp2/3 gene deletion prevalence is above the 5% threshold at the province-level and we sample from multiple health facilities (i.e., clusters). Due to many factors, there may be differences in the cluster-level prevalences and this variation will impact the estimation of overall province-level prevalence. High ICC would mean there is a lot of variation in the prevalence of gene deletions between health facilities, which will in turn lead to higher uncertainty in our domain-level estimate and require larger sample sizes. The Bayesian model in DRpower takes into account ICC to more robustly estimate a ‘mean’ domain-level prevalence.
Based on a historical analysis of pfhrp2/3 studies, we estimated the ICC using the Bayesian model and found 0.05 to be a realistic value that holds true for most studies, which is what is assumed in this app. For more details on the statistical concepts relating to ICC, see the DRpower R package website.
5. Why do I need more than 95% probability to conclude that prevalence is above the 5% threshold? Does this mean I will have 95% power?
This question is a bit tricky and needs a detailed explanation.
Unlike traditional null hypothesis testing, Bayesian methods don’t usually aim to make a clear-cut decision between hypotheses. Instead, they calculate the probability of each hypothesis being true based on the data. To turn this into a decision, we need to set a cutoff — a probability level at which we decide one hypothesis is more likely than the other. For example, we could decide that prevalence is above the 5% threshold if there is more than a 50% chance that this is true. However, the cutoff we choose affects the chances of making errors. A 50% cutoff would give us more power (the ability to detect true positives) but would also lead to a high false-positive rate. By default, we use a 95% cutoff to reduce the risk of false positives.
Why 95%? Before collecting any data, our conclusions depend on our starting assumptions, or prior probabilities. By default, we use a uniform prior, which assumes all prevalence levels are equally likely. This means 95% of the prior probability lies above the 5% threshold, so initially, it’s more likely that prevalence is high. By using a 95% cutoff, we counterbalance this assumption. This makes our starting point neutral: before seeing any data, we are equally likely to conclude that prevalence is above or below the threshold. As new data come in, they shift the evidence and help us reach a definitive conclusion.
The sample size tables here are based on the 95% cutoff. They show the sample size needed to achieve 80% power using this rule.
So, to clarify: power under this method isn’t 95%. It is 80%.
6. What about multiplicity of infection? Is this accounted for in this analysis?
Multiplicity of infection (MOI) refers to a single individual being infected with multiple parasite strains. This is particularly important in pfhrp2/3 studies because only one strain needs to carry the pfhrp2/3 gene for an HRP2-based RDT to likely return a positive result.
Therefore, it is essential to distinguish between two key concepts:
- Prevalence of gene deletions: The proportion of individuals who carry only pfhrp2/3-deleted strains.
- Frequency of gene deletions: This can be defined in various ways, but one common definition is the probability that an infectious mosquito bite introduces a pfhrp2/3-deleted strain.
In settings where only mono-clonal infections occur (MOI = 1), prevalence and frequency are equivalent. However, in high-transmission areas with polyclonal infections, these measures can differ significantly.
In the DRpower analysis, we estimate the prevalence of gene deletions, not the frequency. The advantage of this approach is that prevalence is the most clinically relevant measure—it reflects the proportion of clinical cases that may be missed due to deletions. However, a limitation is that prevalence can vary with changes in transmission intensity. For instance, as malaria transmission declines, infections may become more likely to be mono-clonal, which could increase the observed prevalence of pfhrp2/3 deletions even if the underlying frequency remains unchanged.
Another important consideration is whether polyclonal samples (MOI > 1) are included in the sequencing analysis. This depends on the protocol:
- If a polyclonal sample containing only pfhrp2/3-deleted strains is classified as a deletion, and a polyclonal sample with at least one pfhrp2/3-present strain is not classified as a deletion, then MOI is effectively accounted for, and no further adjustments are needed.
- However, if the protocol excludes polyclonal samples from analysis, the sample size should be adjusted to account for this drop-out. For example, if only 75% of samples are expected to be mono-clonal, the sample sizes provided by this tool should be divided by 0.75 to ensure sufficient data.
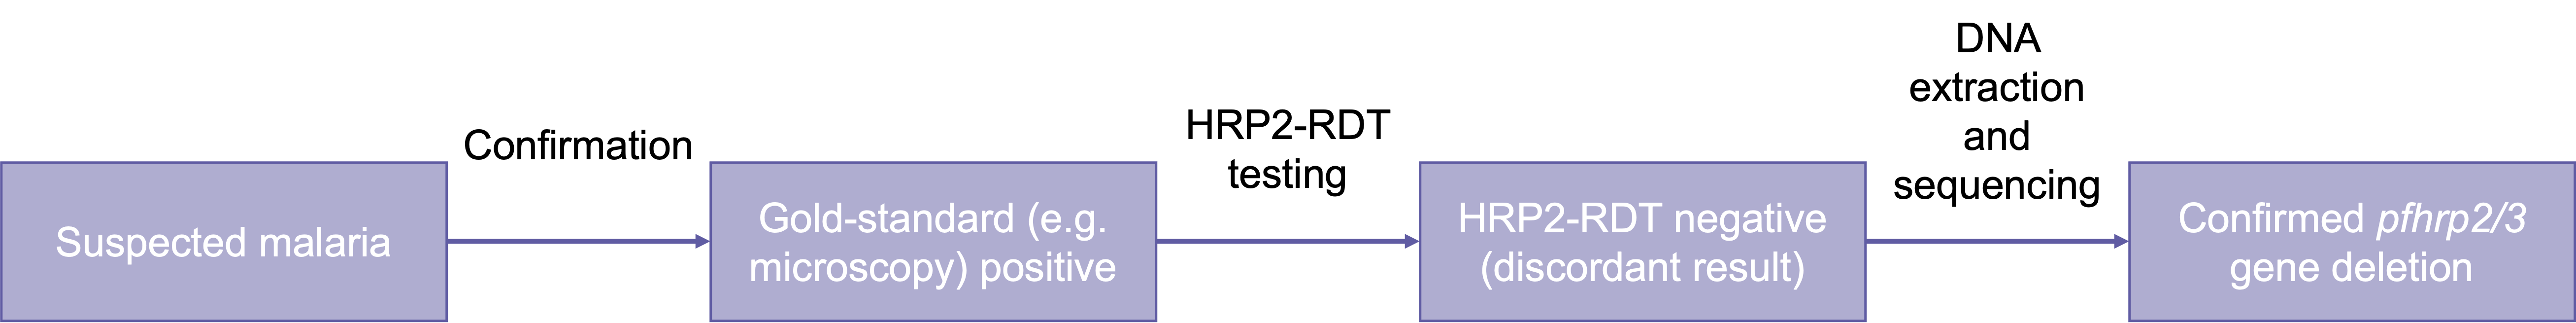
7. What do my sample size numbers actually represent?
In these calculations, the sample size number represents the number of confirmed malaria cases, which may be lower than the number of suspected cases (see schematic below).
8. How do I analyse my data if I have both hrp2 and hrp3 gene deletion counts?
You will need to analyse results for each gene separately. DRpower does not explicitly account for joint analysis of multiple loci, and so we assume you are powering for just one set of deletion counts.
9. What if I want to perform even more bespoke and/or advanced analyses?
We recommend the DRpower R package for more advanced users. For more information on the statistical methods used in the back-end of this app or if you want to do more advanced analyses, please visit the DRpower R package website.